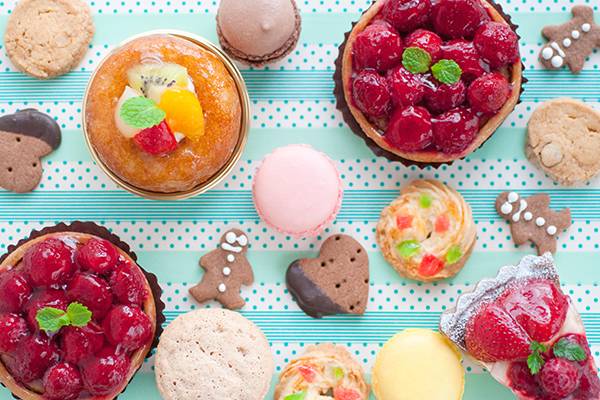
Convenience store desserts can be bought easily at any time. We surveyed people asking for who and what reason they purchase convenience store desserts, which sometimes set trends as new products are released every week.
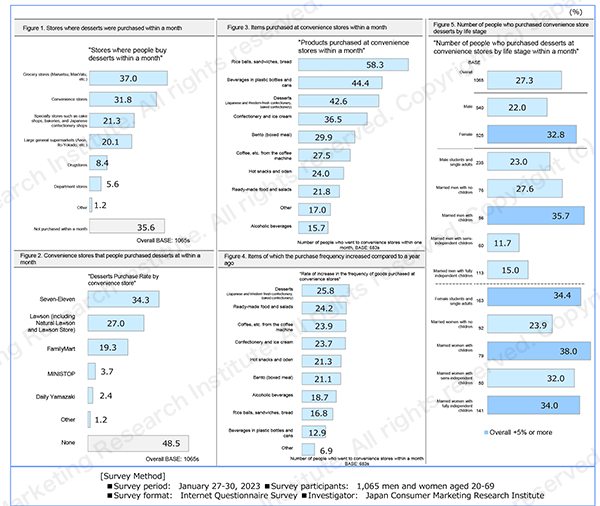
First, let us look at the places where people bought desserts (including non-convenience store desserts) within a month. Grocery stores were the most popular, followed by convenience stores (Figure 1). Over 30% bought desserts at convenience stores, which was about 10% higher than that of specialty stores.
Next, we looked at products purchased at convenience stores within a month (Figure 3). Following "onigiri (rice balls), sandwiches, and bread" and "beverages in plastic bottles and cans," "desserts (Japanese and Western-style fresh confectionery, baked confectionery)" was the third most popular category that over 40% customers purchased.
Next, we looked at those who buy convenience store desserts by gender and life stage (Figure 5). By gender, women are about 10% higher, but married men with children are higher than women as a whole. Among those married with no children, men accounted for a higher proportion than women at the same stage.
Desserts are frequently purchased items at convenience stores (Figure 4), and it's shown that many men also purchase them.
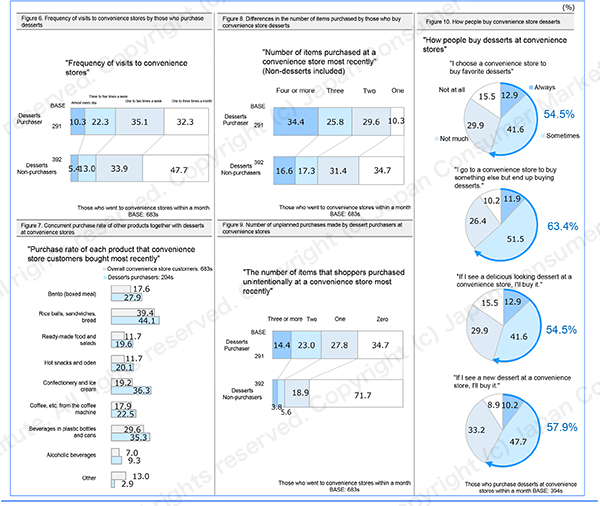
Next, we looked at the purchase situations of people who bought desserts at convenience stores (Figure 6). People who purchase desserts go to convenience stores more frequently than those who don't, showing that over 30% of them go there more than three times a week. This is about 20% higher than those who don't purchase desserts.
In addition, there is an even greater difference in the number of items purchased, including items other than desserts (Figure 8). Those who purchase three or more desserts reached over 60%, while those who don't account for only about 30%. In addition, more than 60% of people who purchased desserts also bought unplanned items, whereas non-purchasers remained at less than 30%. As for products purchased together with desserts, "confectionery and ice cream" showed a large difference in the purchase rate when compared with all convenience store customers, revealing that people who purchase desserts bought them nearly 20% more. (Figure 7). Aside from that, the concurrent purchase rate of all products is higher among desserts shoppers.
Of the people who purchase desserts, the majority of respondents said that they decide which convenience store to go based on the desserts they have (Figure 10). In addition, over 60% of people said that they sometimes buy desserts even though they go to buy other things.
This indicates that desserts are a very important product at convenience stores in terms of the number of items purchased and the frequency of store visits.
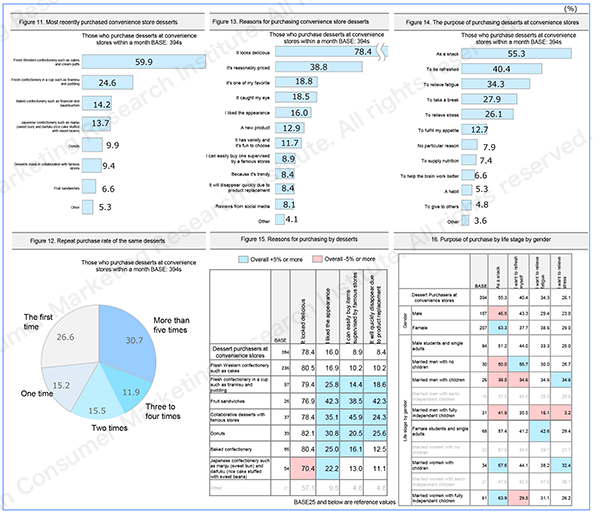
Next, we looked at the reason and purpose of the purchase. The most common reason was "It looks delicious" at almost 80%, followed by "It's reasonably priced" at about 40% (Figure 13). Also, "it caught my eye" came in fourth place. It seems that many people buy them because they are cheaper than those of specialty stores. "It's one of my favorites" ranked third, which is reflected in the repeat purchase rate (Figure 12). 30% of the respondents said they bought the same desserts more than five times, and the repeat purchase rate exceeded 70%.
Next, looking at the reasons for purchasing desserts by type, fruit sandwiches have a higher percentage of "appearance," "supervised by famous stores," and "product replacement" compared with other products (Figure 15). In particular, the reason for "product replacement" is higher than other products, which suggests that they are contributing to the buzz compared to other products, such as limited-time products.
In addition, looking at the purpose of purchasing desserts by gender and life stage, over 60% of women purchase them as a snack (Figure 16). Men are more likely to buy them for the purpose of refreshing or relieving stress than women.
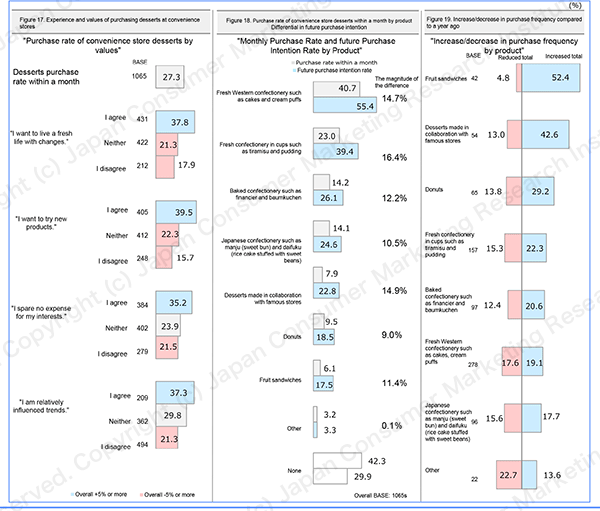
On the first page, we referred to the purchase status by gender and life stage. However, it was values that had a greater impact on the purchase rate. The purchase rate of those who "want to try new products" is the highest at 40% (Figure 17). Apart from the above, the purchase rate of people who "want to live a fresh life with changes" and pursue "hobbies" and "trends" exceeded the total. We think that people who are influenced by trends are also attracted to desserts at convenience stores, where new products are frequently released.
Next, we compared the purchase rate of convenience store desserts by product within a month with future purchase intentions. The result showed that the future purchase intent was higher than the purchase rate within a month on all products (Figure 18). The market is expected to grow even further as the result suggests that more people intend to buy desserts in the future.
As we have seen, desserts at convenience stores are not only highly attractive, but also are an important factor that motivate customers to visit the stores, affects the reason they choose particular stores, and also are a product that leads to an increase in the number of items customers purchase. It can be said that it will continue to give vitality to convenience stores in the future.
Translating articles
- 6.9 Trillion Yen Market Created By Women― Will Afternoon Tea save the luxury hotels in the Tokyo Metropolitan Area
- The Penetration of Premium Beer, and a Polarization of the Growing Beer Market
- Frozen Foods' Benefits Are Expanding, and Child-raising Women Are Driving Demand
おすすめ新着記事

消費者調査データ ビール系飲料(2026年7月版) 独走「スーパードライ」、今後意向はダブルスコアに
消費者調査データ ビール系飲料(2026年7月版) 独走「スーパードライ」、今後意向はダブルスコアに
成長市場を探せ クラフトウォッカがけん引 市場は4年連続2桁成長
国産ウォッカ市場が急拡大している。22年から4年連続で2桁成長、25年には1998年以降の最高を記録した。成長をけん引しているのはクラフトウォッカだ。シュリンクするアルコール市場のなかで、今後も成長が期待できるジャンルとみなされている。

消費者調査データ エナジードリンク 市場は混戦模様? 「ZONe」は「モンスターエナジー」を超えられるか
拡大するエナジードリンク市場。トップブランドの「モンスターエナジー」に、「ZONe」、「レッドブル」を交えて混戦模様が続いている。


![戦略家のための知的羅針盤[エム・ネクスト]product by 松田 久一](/img/mnext-sub-title.png)